The vast majority of new content creators on short-form video platforms see views and likes as a true measure of a piece of content's performance. After all, views literally tell you how many people watched your video, while likes act as a clear stamp of approval of your content, right? These two are the most visible user engagement metrics for novice creators, and this visibility often leads them to prioritize likes and views when measuring the performance of their short-form content.
In reality, the most visible social media engagement metrics tend to be the least impactful at measuring actual engagement. Sure, they look good on paper, and it feels really nice to see your view and like counts rise whenever you post a new video. But they don't actually show how users are interacting with your content, or how the algorithm is evaluating and distributing your videos. You'll need to look past surface-level numbers to find the engagement metrics that accurately reflect how your short videos are performing.
This guide will discuss the core engagement metrics that truly matter for measuring content performance and how different platforms weigh them. By the end, you will be able to interpret the most relevant engagement metrics and use them to improve your future content.
Why Views Alone Don't Tell the Full Story
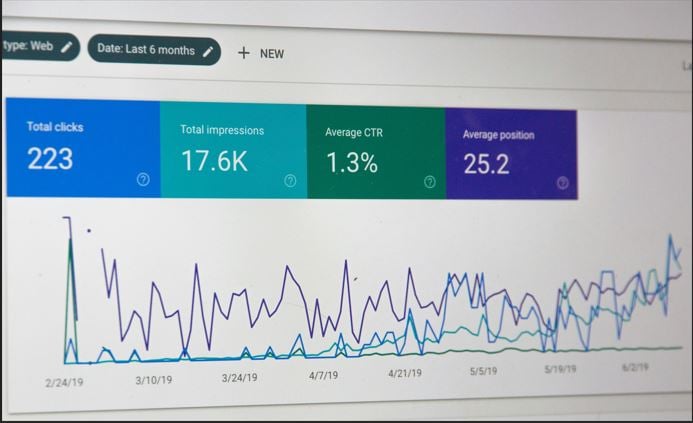
Views actually rank pretty low in the hierarchy of engagement metrics algorithms use to determine the value of a new piece of content. In fact, a decent portion of the views a new short video gets aren't necessarily from engaged viewers or organic growth. When you post a new short-form video on a platform like TikTok or Reels, the resident algorithm tests the content against sample audiences to determine whether it's worth recommending to a wider audience. This algorithmic testing exposure often causes view counts to spike, making view counts even less accurate for determining the true value of a piece of content.
Views just don't reveal whether your videos actually resonated with viewers. With platforms like TikTok registering a "view" as soon as a video starts playing on a user's feed, views don't even tell you if users watched your videos from start to finish or dropped off midway. They don't provide any real, actionable data that a creator could use to tweak and improve their content strategy over the long term. Thus, a tracking strategy that's built around views will be completely ineffective at measuring how your short-form content is performing.
Let's talk about the metrics that actually matter when measuring content performance on short-form video platforms.
Core Metrics That Reveal True Performance
The most effective engagement-tracking metrics provide creators with actionable data they can use to tweak and improve their content strategies consistently. These metrics will help you figure out the parts of your strategy that are working and those that aren't.
Completion Rate and Average Watch Time
Completion rate and average watch time are the core engagement metrics that algorithms use to evaluate new content. The former refers to the percentage of viewers who watched a video from start to finish, compared with the total number of viewers who started watching it. A high completion rate signals to platform algorithms that your content delivers value and incentivizes them to scale up its distribution.
On the other hand, "average watch time" refers to the average number of seconds users spent engaging with your video before scrolling away. Algorithms on short-form platforms see "average watch time" as a primary measure of content quality and audience interest. Both metrics aid algorithms in achieving their key objective and maximizing user engagement on the platform, making them the strongest indicator of a piece of content's value to users and the algorithm.
Engagement Rate Relative to Reach
This metric shows the number of unique viewers who interacted with your short-form content relative to the total number of unique accounts that saw it. It is measured by dividing total engagement by total reach and multiplying it by 100. Reach is the number of users who saw your content but didn't necessarily interact with it. In contrast, the engagement metrics used in calculating engagement relative to reach are likes, comments, saves, and shares.
Social media users on short-form video platforms can scroll past dozens of pieces of content every day; engagement relative to reach tells you exactly the number of people who chose to stop the scroll and consume your content. Incorporating engagement rate relative to reach will give you a more accurate picture of the viewers who are genuinely interested in your content.
Shares and Saves
Lots of content creators underestimate just how important shares and saves can be to their content strategy. To the algorithm, these two metrics represent clear, long-term value in a way other engagement metrics simply can't. Saves indicate that content has sufficient utility or value to sustain user attention across repeated views. In contrast, shares indicate that the content was valuable enough for viewers to share with others.
Both these metrics are vital to measuring short-form video performance. They act as the ultimate stamp of approval to the algorithm, signaling that your content is so valuable and engaging that it can sustain multiple views and even break into new networks.
Reading Metrics Together, Not in Isolation
Think about it: how can you effectively measure your content's performance if you don't consider all the pertinent data points together? Focusing on just one or two metrics, rather than considering the pertinent metrics together, will give you an inaccurate picture of your content's performance. You must read reach, engagement, and retention metrics together and combine the data points to get a true reading of your account's success.
High Views With Low Completion Rate
A high view count looks good in isolation but can be misleading. Comparing your view count to completion rates, however, can expose weaknesses in your content strategy that may cap further distribution. In this case, high views with low completion rates indicate that your hooks are engaging enough to reel viewers in, but the rest of the videos don't hold their attention. It could be an indication of poor pacing and editing, or maybe you deliver the payoff too quickly, triggering high drop-off rates midway.
High Engagement With Low Reach
High engagement with low reach indicates that your content is very engaging to the limited audience that has seen it. This combination typically indicates that the content had a strong connection with the audience it reached but had a very narrow initial test audience, or hasn't been distributed widely enough to reach its full potential. Creators who note this combination in their content may be creating videos that are too niche for the algorithm to distribute broadly, using inefficient thumbnails and hooks, or just aren't being clear enough with their keywords and tags.
Strong Completion Rate With Few Shares or Saves
This combination suggests that although your content was entertaining and well-paced enough to keep viewers watching to the end, it doesn't offer any lasting value, identity appeal, or strong emotion that would encourage viewers to save it for future consumption or share it with friends and family. Content with strong completion rates but relatively few saves and shares is engaging enough for one watch but not compelling enough to revisit or pass on.
Platform-Specific Metrics Worth Knowing
On average, short-form video platforms prioritize watch time and completion rates, alongside saves and shares, when evaluating a piece of content's value. However, you should know that these platforms aren't monolithic, and each of them has its own idiosyncrasies.
TikTok Analytics
TikTok, where top-performing videos average 30-50 seconds, places significant emphasis on completion rate, "average watch time", and traffic source breakdown. The first two provide numbers on how many people watched your videos to completion and how much time they spent on them. Traffic source breakdown shows where users on the platform discovered your individual videos. This could be via the For You Page, the Following page (for your existing fans), through Search (implying targeted intent), or other channels like Personal Profile, Hashtags, or Sounds.
Instagram Reels Analytics
Instagram, on the other hand, focuses on retention rates, shares, and reach relative to follower count. Retention is the percentage of your content that viewers watched before dropping off. Reach relative to follower count allows the platform to determine how many of your views came from your existing followers versus organic discovery by new viewers.
YouTube Shorts Analytics
For creators on YouTube Shorts, swipe-away rates, average view duration and retention, viewed percentages, and impressions click-through rate (CTR) are the metrics that truly matter. Swipe-away rates measure how many people left your video; view duration and retention track where viewers dropped off in your videos; and viewed percentages show how much of your Short viewers watched. Impressions click-through rate will help you track how well your titles and thumbnails earn that first click.
The Right Metrics Tell You What to Do Next
To get an accurate measure of your content's performance on short-form video platforms, you'll have to look past view counts to the metrics that actually explain how your videos are performing: engagement relative to reach, "average watch time", completion rate, shares, and saves. Read together, they reveal how users on the platform are genuinely interacting with your content and can help you optimize your content strategy for the engagement metrics that incentivize algorithms to scale up content distribution.
