With around 2.8 billion MAUs, YouTube is one of the most visited websites, perhaps only second to Google. This offers brands a massive opportunity to be seen by their target audience. However, the platform can be quite competitive, as statistics indicate that around 2000 videos are posted every second on YouTube.
If you are only creating videos and uploading them on YouTube, it can be hard to gain visibility. The good news is that you can use YouTube analytics data to get ideas for the kind of content that resonates with your target audience. This can be a key part of leveraging social media analytics for data-driven growth. For the best results, you need to do more than just collect the data; instead, learn how to interpret it. In this article, we guide you on how to do that effectively.
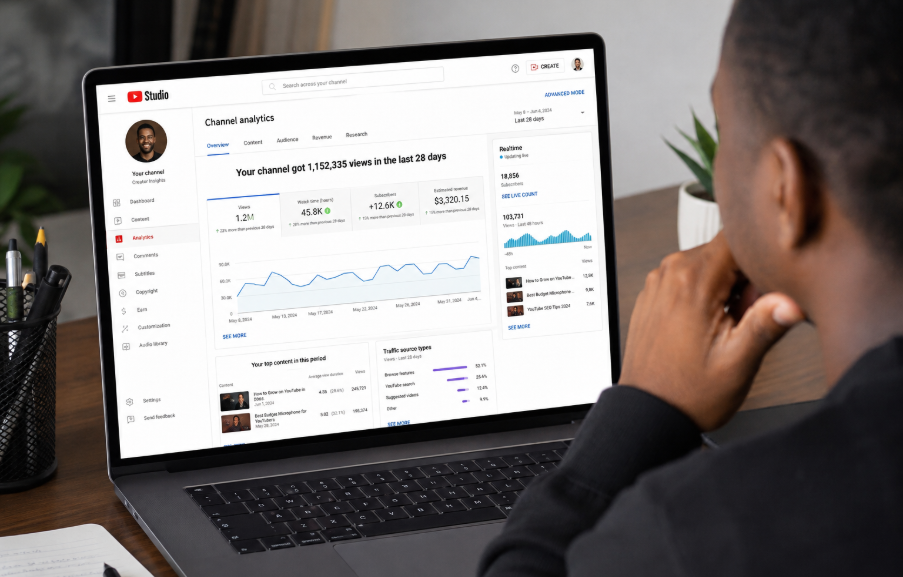
Why Leverage YouTube Analytics Data
By paying attention to your YouTube Analytics Data, you can get insights into:
Effective Content Formats
Checking the YouTube Analytics data will provide insights into not only the content that is doing well, but also the reason for its good performance. By paying attention to metrics such as the CTR, average view duration, and engagement rate, you can get insight into the content formats that will drive a good response from the audience. This insight can help you refine your content production, improve on the proven framework, and ensure that you replicate the best-performing content.
Attract Your Target Demographics
Understanding who is watching the videos and how they find them can be key to your smart targeting. Interest and demographic reports can show the segments of your audience delivering the highest value, while the traffic source can show how they get into the funnel. Such a precision level can enable you to tailor content in a way that attracts the right audience and improves brand affinity.
Improve Your Overall Marketing Strategy
YouTube is one of the most powerful marketing platforms. You can use analytics to provide the data needed to track the effectiveness of your campaign and ROI, and improve your overall marketing strategy. This ensures that you can justify your marketing budget and prove the ROI on your marketing budget.
How to Find YouTube Analytics Data
The good news is that you don't need any detailed tools to collect the YouTube Analytics data. This data can be seen in the YouTube Studio.
You can access it in the following steps:
- Log in to YouTube. At the far right, tap on the profile image.
- From the appearing drop-down menu, choose YouTube Studio.
- In YouTube Studio, tap Analytics from the screen's left-hand side.
- You will be taken to the analytics dashboard, providing important details on the performance of the channel for the last 238 days. If you want a different period, you can adjust the timeframe.
Understanding the YouTube Analytics Feature
Under the YouTube Channel Analytics, you will see four tabs displaying different data. These are: Overview, Audience, Content, and Research.
Overview Tab
This provides a general overview of the performance of your channel while showing important metrics such as views, subscribers, estimated revenue, and watch time. You can view different metrics under the content tab, such as:
- Views. This refers to the number of people visiting your channel over a certain duration. However, to be considered a view, a YouTube viewer must watch the video for a minimum of 30 seconds.
- Subscribers. A metric that tracks the new subscribers gained. It is obtained by subtracting the subscribers lost from the ones gained. Once you get the figure, you can use our tips for increasing YouTube subscribers.
- Watch time. This metric offers an aggregate of the total number of hours your viewers watched the channel.
- Top videos. You can view your best-performing video from the overview tab.
- Real-time view. A metric that shows the total number of users who watched your video in the last 48 hours, with the metric updating in real-time.
Content Tab
It shows how your audience is finding and interacting with the content, and the content they watch most. It includes a report on the following:
- Impressions & click-through rates (CTR). Impressions refer to the number of times your videos are shown to YouTube viewers, whether in the search results, homepage, or the Up Next section. The impression CTR is the percentage of impressions that resulted in a click on the video. If your videos are getting a high CTR, it shows you have added thumbnails and titles that resonate.
- Traffic source. This metric shows that your viewer found the video. The common sources of traffic are suggested video, YouTube search, browse feature, and external.
- Top-performing shorts and videos. This is a report on your top-performing video, live stream, and shorts based on the watch time, views, and other similar engagement metrics. It can be a good metric to show the content that best resonates with your target audience.
You can also see insights into the different video performances. You can view the performance of a video by:
- Clicking on the Content tab under YouTube Studio, on the right side of the screen, and using the search bar to search across the channel.
- You can view any video and hover the cursor over it to see its data. Choose Analytics.
Audience Tab
It provides a summary of the viewers watching the videos, including details of the new and returning viewers, subscribers, and the total members. It is, therefore, an important section to help you understand your viewers better and gain insight into their demographics and behaviors.
In this feature, you will see:
- New viewers. These are the new people who are watching your channel for the first time in a given timeframe.
- Returning viewers. These are those viewers who have previously watched the content on your channel and have returned within a certain time frame. A balance between new and returning viewers reflects that your channel is growing while you have loyal viewers.
- Unique viewers. This is the total number of viewers watching the video, regardless of how many times they watched the video.
- Demographic data. This provides a breakdown of your audience depending on their age, gender, and geographical location. This data is important as it helps you to tailor content, ads, and language accordingly.
- Viewer activity. This metric will show your audience activity on a certain day or hours of the week, showing when your viewers are most active. It can be a good metric to help you align your content with the audience behavior and publishing schedule.
Research Tab
This tab offers insights into what your viewers and all audiences on YouTube are searching for. It contains these sections:
- Exploring audience searches. A section providing insight into the search terms your audience is using and the industry at large. This makes it a powerful tool for audience targeting and keyword ideas.
- Content gap. When you see the popular search queries you may have missed, you can identify any content gaps and create videos that match the demand of the viewers, increasing discoverability.
Revenue Tab
This tab is only available for monetized channels showing a good picture of your earnings. It shows different metrics, such as:
- Estimated revenue and RPM. This shows your total YouTube earnings over a given period. The RPM (revenue per thousand impressions) can show the overall efficiency of your monetization effort.
- Top-earning content. This metric ranks videos according to the total revenue. It can show the specific upload format and topic that generates the highest ROI and can, therefore, be an important report for diagnosing the topics driving higher earnings.
- Revenue source. A report that shows how your total channel revenue is composed across different streams, including the different ad formats.
Top YouTube Metric to Watch
We have seen the general overview of the YouTube Analytics data. Let us now look into the data to pay more attention to for your channel growth.
Watch Time
This is one of the metrics with a high value on YouTube, impacting YouTube ranking. It shows the total number of minutes viewers are spending watching your content at a given time. YouTube's algorithm usually recommends the videos and channels that keep viewers on the platform.
That means if your video is getting a high watch time, the algorithm interprets that as a sign that you are creating content that is genuinely helpful. This will impact the frequency at which your video will be shown in areas such as the Suggested videos, Browse feature, and Home feed.
If you want to increase your watch time, you should focus on creating a channel that will consistently grow your watch time. To find the metric to view this data, you need to go to YouTube Studio> Analytics, and the Overview tab. You will see the watch time displayed in total hours for the number of hours.
To analyze this data further, go to the Content tab, where you will see the breakdown of the watch time according to the video, live stream, post, and short. This makes it possible for you to compare the performance across different content formats.
You can interpret the watch time according to:
- Absolute watch time. This metric reflects the raw data on the number of hours worked. It can be a good metric for benchmarking your channel over several months or years.
- Watch time by geographic location. A metric that will show you the geographical location that is contributing the most to the watch time. It can help you to plan your content uploading schedule, choice of language, and the content opportunity in each region.
- Watch time per traffic source. This helps you segment your watch time according to the source of traffic, such as Browser, Search, Suggested, and External. It shows the channels that bring the most clicks.
Watch Time Optimization
You can increase your watch time through various tips, such as:
- Use a strong hook at the beginning to prevent any early drop-off.
- Use a chapter to enable viewers to navigate around the longer content format.
- Add your playlists to your end screen to encourage viewers to keep watching.
- Find the video format with the highest watch time for a particular audience.
- Compare watch time across different videos and competitors and use the data to improve your content.
Average View Duration
This shows the average time a viewer watches a video before scrolling and is often expressed in minutes and seconds. It can be a good indicator of the quality of your content and the video pacing. This is different from watch time, which shows the volume of videos watched across channels.
On the other hand, the average view duration digs deeper into the engagement metrics of a video. It can, therefore, be a good metric for showing if the viewers are genuinely interested in the content or whether they are abandoning it.
You can view this metric in YouTube Studio Analytics, then the Content tab, and the Individual video. You can view the average view duration on the overview panel, along with other metrics such as views, impressions, and CTR.
There are several tips you can use to benchmark your average view duration, such as:
- Percentage viewed. The average view duration is usually expressed as a percentage of the total video length. If your video receives a percentage of more than 50%, it is considered a strong benchmark, even though it will also depend on the video length and niche.
- Format comparison. Long-form videos, live, and shorts have different average view durations. Therefore, compare formats across different categories.
- Long-term trends. If you notice that the average view duration is declining over a period of time, it shows that there is a reduction in the audience that is discovering your video through suggested videos or search. It may be a sign that you need to redo the introduction, title, and thumbnail.
You can use several tips to improve the average view duration, such as:
- Leveraging pattern interrupts, such as graphics, b-roll, and a tonal shift to re-engage the viewer in the middle of the video.
- Showing value in your first 30 seconds.
- Avoiding a slow introduction.
- Adding a clear narrative progression to structure the video.
- Reviewing the average video duration curve to see the timestamps for viewer disengagement, ensuring a more targeted optimization.
Impression CTR (Click-Through Rate)
The impression CTR tracks the percentage of times the thumbnail of your video was shown to YouTube viewers in the suggested videos, Browse feature, or home feed, resulting in a click. This metric is a great way to track how effective your thumbnail and titles are. You can view the CTR data under YouTube Studio Analytics, then click the Overview tab under the channel-level metrics for the individual videos.
You can click the Reach tab to see the funnel from the Impressions to watch time and views, ensuring that the conversion breakdown is visible. To calculate the CTR, you should divide the clicks by the impressions and multiply the result by 100. Every time a video thumbnail is shown to a viewer for over a second with over 50% of the thumbnail visible, that counts as an impression.
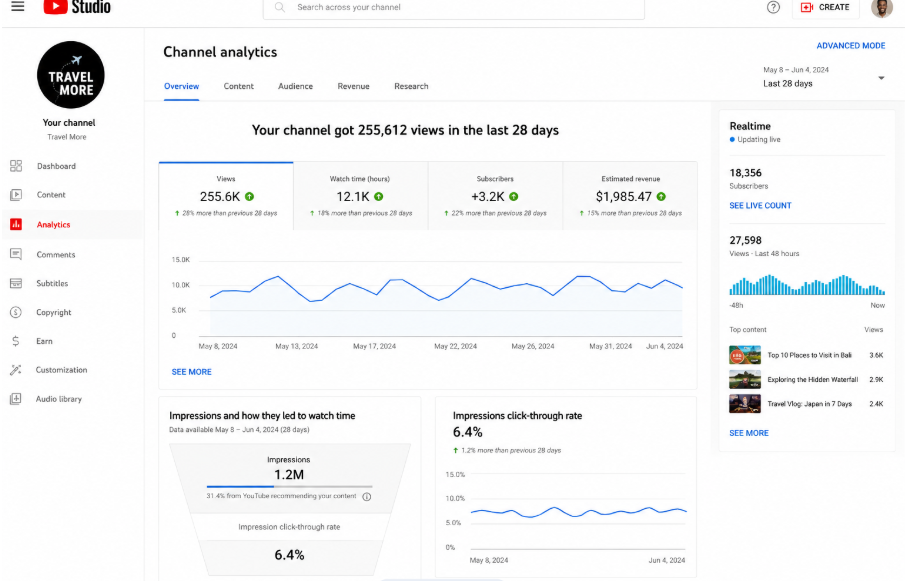
According to the YouTube data, the majority of channels have a CTR that ranges from 2% to 10%, with the smaller and newer channels experiencing a higher rate because their initial target audience is more targeted.
Here is what you need to know when interpreting CTR data:
- High CTR and low view duration. Note that the best results combine the CTR data with the average viewer duration. If the CTR is high and the average view duration is low, it indicates you are using a misleading thumbnail or title. Your users are clicking but leaving fast, which may cause the algorithm to stop distributing your content as much as possible.
- CTR as per placement. Take note that the CTR is broken down by YouTube according to the source of traffic. If the CTR is from the browse feature, it shows that your thumbnail is appealing to cold audiences. If the CTR is from subscriptions, this shows you have a loyal audience.
- A declining CTR. The CTR tends to go down as the video grows older and reaches a larger audience. If you want to get a clearer picture of your CTR, you need to compare the CTR of your first 48 hours with that of your first 30 days.
There are several tips you can use to optimize your videos for CTR, such as:
- A/B test the thumbnails using the built-in feature of YouTube.
- Use a clear focal point, visual contrast, and minimum text.
- Leverage emotional response in the thumbnail.
- Add a curiosity-creating title.
- Show value clearly.
Audience Retention Curve
The audience retention curve shows the average number of viewers watching every second of the video. This is one of the most important metrics, as it turns the abstract engagement into a visual map of your audience's behavior. To read this curve, you should begin by noting that it usually starts at 100% when your video is at zero seconds but keeps declining as the video progresses.
You can view this curve by going to the YouTube Analytics> Content tab. You can then click on the individual video you want to analyze. You can tap on the Engagement tab. You will see the Audience retention graph here, together with the video playlist. You can click on a part of the curve and jump into the timeline to see the content.
You can also interpret the curve as follows:
- Steep curve or early drop-off. This is a sign that your YouTube viewers are dropping off within the first 15 to 30 seconds, showing that you have a poor introduction that doesn't deliver on the promise of the title or thumbnail.
- Steady or gradual decline. This is often a normal attrition of the viewer, showing that you are creating content that holds the viewer's attention well.
- Sharp drop in the middle. This can reflect that there are certain parts that viewers are quickly losing interest in. It could be a problem with irrelevant content, pacing, or poor topic transitions.
- Re-watch or spikes. When you see a part where the curve rises sharply compared to other sections, it shows that viewers are rewinding that part and rewatching. This is a strong signal that this part is a reflection of high-quality content that you can consider creating more such videos on in the future.
The YouTube retention data is also categorized into two types.
- Absolute retention. A reflection of the raw data that viewers watch at each part.
- Relative retention. Compares the retention data of your video with that of other videos on YouTube with a similar length.
When you review the retention data of 10 to 20 videos, you might be able to discover a pattern, such as:
- The style of introduction retains the most viewers.
- The video segment is causing fatigue.
- The content format is causing sustained attention to the end.
These patterns are what should inform your future video creation strategy, right from the scripting to the editing and creating a structure.
Subscriber Growth Rate
This is a good metric that helps to track your channel's velocity, or the speed at which your channel is getting new subscribers over a certain period. It considers the new subscribers gained versus the unsubscribe rate. This metric is a good indicator of the overall health of the channel, whether the content is audience-fit, and how sustainable your viewership is for your viewer base.
You can view this metric in YouTube Studio Analytics> Overview tab or subscriber tab. If you need a deeper analysis, you can visit the Audience tab, which will show the subscribers' growth over a particular period and will break down the exact videos that drive the highest subscriptions and which ones resulted in the highest unsubscribe rate.
Here is what you need to know when interpreting the subscriber data:
- Subscription-driving videos. This reflects the videos that are helping you turn those casual viewers into fully committed followers. You should, therefore, analyze what you are doing right by checking different elements such as format, length, topic, and where the CTA is placed. You can then replicate these elements in other videos.
- Videos are driving the highest unsubscribe rate. When you notice the videos driving the highest unsubscribe rate, it's a sign that the content of these videos doesn't match the expectations of your current subscribers. This is particularly the case when your channels start to experiment with different topics and formats, without enough preparation.
- Subscribe to the traffic source. When you understand the source of the subscribers, whether it's Browse, Search, or even Suggested videos, you can assist your team in determining whether this growth is algorithm-driven or from the direct audience.
In Conclusion
If you want to succeed as a creator on YouTube, you must understand analytics data and use it to improve your content. Fortunately, YouTube has one of the most detailed analytics tools that will provide nearly any information you need on your video performance and channel growth. By following the steps outlined in this guide, you will understand the key data to track and how best to track it.
